Vulnerability Workflow - Biotope - user data
Background<div>
Information about the incidence and impact of Non-indigenous and Invasive Species (NIS) are often scattered across different spatial, temporal and taxonomic scales and, therefore, it can be difficult to draw any comprehensive conclusion about the most vulnerable ecosystems or map the areas more at risk of biological invasion. Occurrence data are usually collected using a variety of sampling approaches and the impact of NIS can affect ecosystems at any biological scale (e.g., individuals, populations, communities, etc.) and with different degrees of severity. The heterogeneity of species occurrence data and the complexity of multiple effects acting at different biological scales and determining ecosystem-dependent changes make estimations of NIS incidence and impact difficult on large geographical scales.</div><div><br></div><div>Introduction</div><div>
Comprehensive, standardised and modular methods to assess both incidence and impact of NIS at different spatial scale (e.g., continental, regional, local) are required to support management and conservation actions and to prioritise areas of intervention. To achieve this objective, researchers have developed two standardised approaches to quantify the incidence and the impact of NIS on ecosystems respectively by means of: occurrence cubes and analysis of the Cumulative IMPacts of invasive ALien species (CIMPAL). Occurrence cubes consist of species occurrence data aggregated on a three-dimensional space (cube) whereby the three dimensions considered are taxonomic, temporal and spatial. Data cubes allow the homogenisation and aggregation of heterogeneous data collected using different methods and standards. The CIMPAL model allows the mapping of cumulative negative impacts of NIS on different ecosystems (marine, freshwater, terrestrial) on the basis of existing evidence. NIS impacts can be additionally mapped according to the main associated pathways of introduction and the relative importance of species on cumulative impacts can be inferred. Using these two standardised methodologies, vulnerability map of biotopes can be produced in order to identify hot spots particularly threatened by NIS and that, in turn, would require special protection and maintenance.</div><div><br></div><div>Aims
This validation case aims at using the occurrence cube approach and the CIMPAL model to map ecosystem and habitat type vulnerability at continental scale, inferring the relevance of key risk factors (e.g. vectors of invasion) and intrinsic resistance/resilience components (e.g. native biodiversity, food web structure, etc…) and design scenarios of change, in the context of expected climate changes, for ecosystem and habitat types found highly vulnerable to NIS.
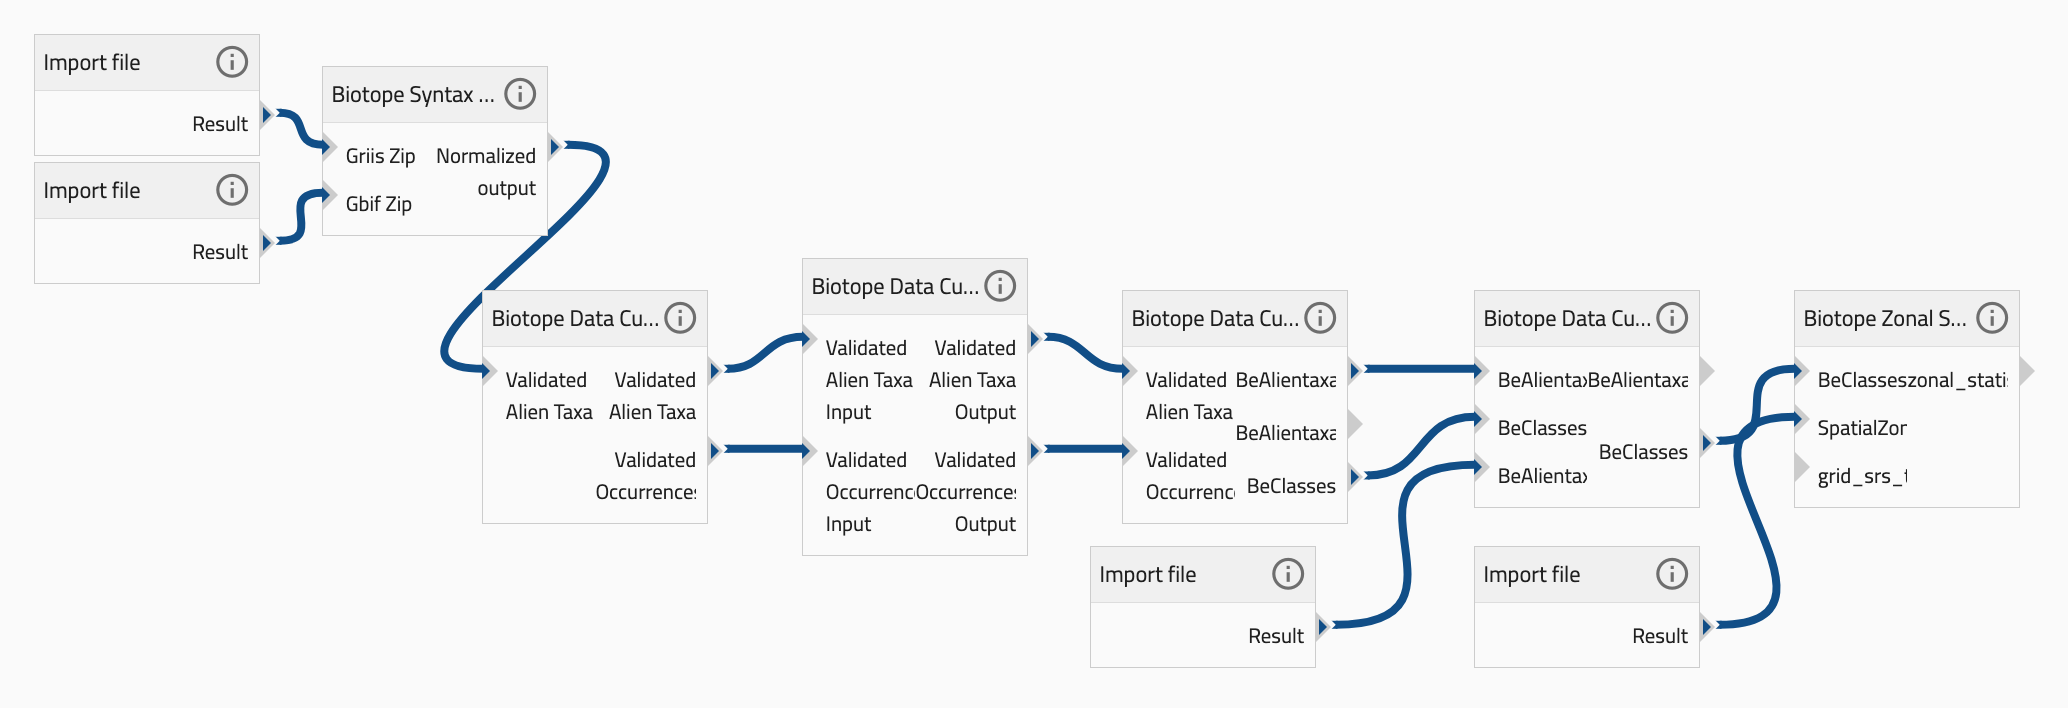
The workflow developed offers a valuable tool that may assist policy makers and managers in their efforts to develop strategies for mitigating the impacts of invasive species and improving the environmental status of marine waters. The method, although tested on the the marine environment, can easily be transferred to the terrestrial environment as well.</div><div><br></div><div>New developments: the original Biotope workflow (available at <a href=" https://metadatacatalogue.lifewatch.eu/srv/eng/catalog.search#/metadata/30d404c5-eba4-4ca0-a273-983413960868" target="_blank"> https://metadatacatalogue.lifewatch.eu/srv/eng/catalog.search#/metadata/30d404c5-eba4-4ca0-a273-983413960868</a>) has been updated and released in three different versions according to the imported data: user data; GBIF data; and by using CIMPAL calculator.</div><div><br></div><div>This workflow describes the option with user data.</div>
Default
- Date ( Creation)
- 2019-07-04
- Date ( Publication)
- 2021-03-18
- Status
- Completed
- Keywords
-
Biotope
- Keywords
-
IJI
- Access constraints
- License
- Use limitation
-
GPLv3
- OnLine resource
-
Info page
(
WWW:LINK-1.0-http--link
)
- OnLine resource
-
Run the workflow with your data
(
WWW:LINK-1.0-http--link
)
- Service Name
-
Biotope Syntax Normalizer
- Service Description
-
This service aims at normalising the user datasets to be consistent with the accepted formats. It is part of the Biotope workflow (with user data, GBID data and CIMPAL calculator) of the Internal Joint Initiative.
- Service Reference (id)
- Service Name
-
Biotope Data Cube Builder
- Service Description
-
This service aims at building two datacubes based on the occurrences. The datacube aggregates (=counts) occurrences on a regular grid. This count has a stochastic component that takes the uncertainty field into account. All this process has been developed in R in the frame of the TrIAS project. It is part of the Biotope workflow (with user data) of the Internal Joint Initiative.
- Service Reference (id)
- Service Name
-
Biotope Data Cube Analyst
- Service Description
-
This service aims at crossing the datacube with a geographic layer in order to compute incidence information per zone. This information is extracted based on the geolocation code. It includes a tool to visualize the outputs rasters. It is part of the Biotope workflow (with user data) of the Internal Joint Initiative.
- Service Reference (id)
- Service Name
-
Biotope Zonal Statistics Producer
- Service Description
-
This service aims at producing the zonal statistics. The Python and C++ codes provides a generic tool to extract the statistics from a geographic layer with quantitative values for each patch of a categorical map. For example, it is used in this workflow to compute the average vulnerability inside different administrative polygons. It is part of the Biotope workflow (with user data, GBID data and CIMPAL calculator) of the Internal Joint Initiative.
metadataMetadata
- File identifier
- 7b7ef4a9-242e-40e9-90be-b8da025b0f61 XML
- Metadata language
- en
- Hierarchy level
- Workflow
- Metadata Schema Version
-
1.0