Species occurrence trend analyzer
This is a NaaVRE workflow component / building block that calculates, visualises, and stores temporal trends in biodiversity metrics, enabling users to analyse changes over time and interpret results through plots and exported data.
Default
- Date ( Publication)
- 2025-11-05
- Status
- Completed
- Version
-
11
- Keywords
-
biodiversity metrics
- Keywords
-
temporal trends
- Keywords
-
plotting
- Keywords
-
data management
- Keywords
-
Marco-Bolo
- Access constraints
- License
- Use limitation
-
MIT license
- OnLine resource
-
Link to the workflow component source code on Github
(
WWW:LINK-1.0-http--link
)
- OnLine resource
-
Workflow containing the workflow component
(
WWW:LINK-1.0-http--link
)
- Operation name
-
Cleaned species occurrence data
- Description
-
Cleaned species occurrence data CSV file used for trend analysis.
- Function
-
Input
- Operation name
-
Cleaned species occurrence metadata
- Description
-
Cleaned species occurrence metadata CSV file used for trend analysis.
- Function
-
Input
- Operation name
-
Output file of the biodiversity time species analysis for European marine ecosystems trend analysis
- Description
-
Output CSV of the trend analysis.
- Function
-
Output
- Operation name
-
Diversity frequency distribution plot
- Description
-
Output plot showing the frequency distribution of the diversity in the provided dataset.
- Function
-
Output
- Operation name
-
Richness frequency distribution plot
- Description
-
Output plot showing the frequency distribution of the richness in the provided dataset.
- Function
-
Output
- Operation name
-
Abundance frequency distribution plot
- Description
-
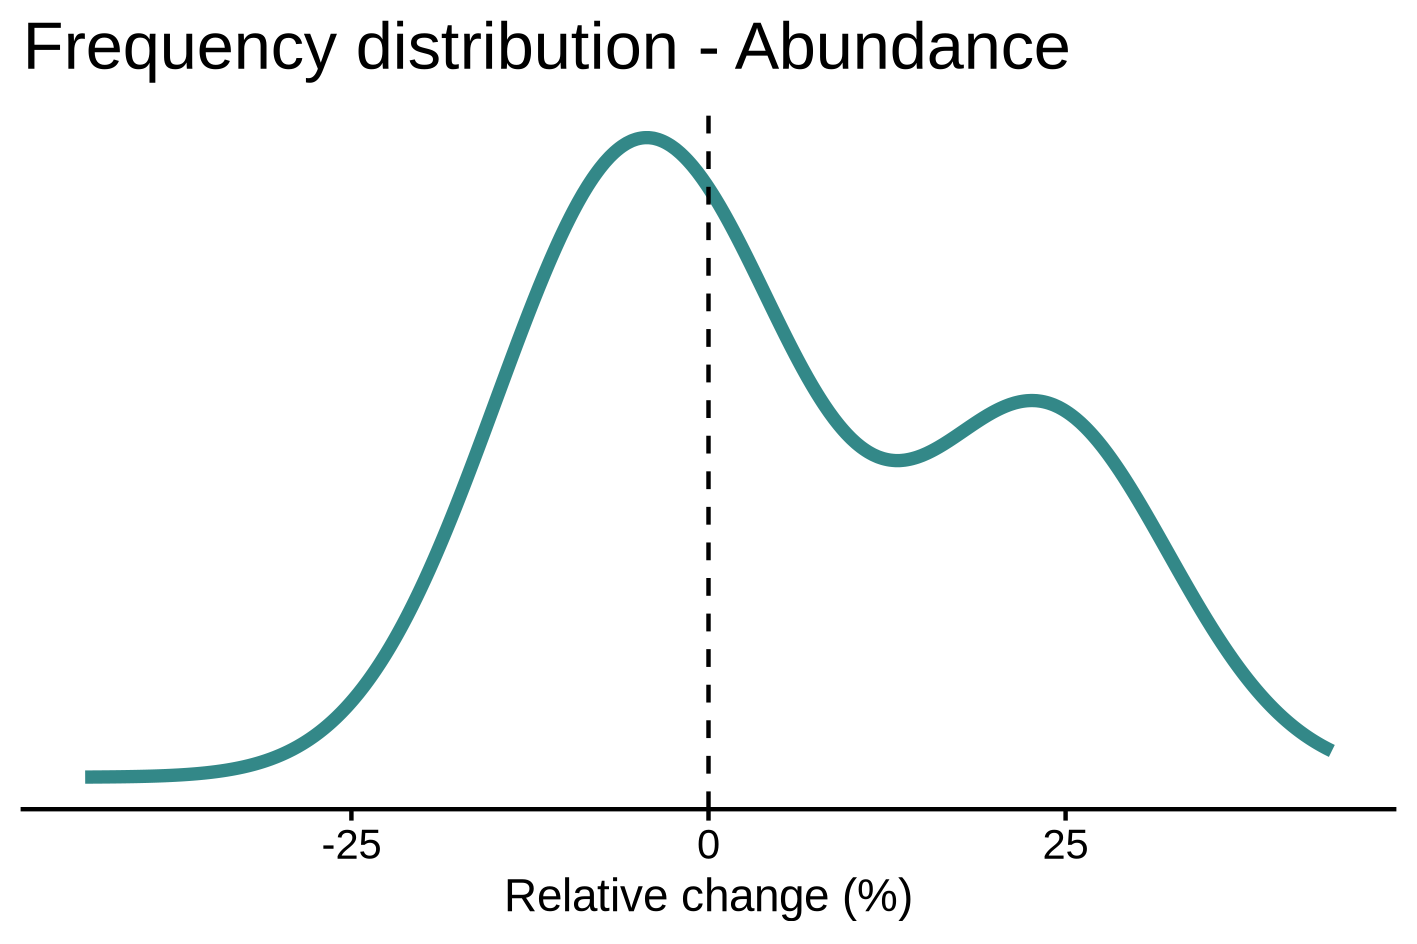
Output plot showing the frequency distribution of the abundance in the provided dataset.
- Function
-
Output
- Service Category
-
data processing
- Service Language
- eng
- Service TRL
- TRL 7 – System prototype demonstration in operational environment
- Service Helpdesk
metadataMetadata
- File identifier
- 84ce3a66-3826-488d-9dc2-eeeac0a2cb7b XML
- Metadata language
- en
- Hierarchy level
- Service
- Metadata Schema Version
-
1.0